Leaf Litter Lab
Pre-Lab Questions:
1. Why would we want to rate the amount of biodiversity in a location?
To tell whether an ecosystem is healthy or not. If we track the biodiversity over time, we can tell whether the ecosystem is changing or stabilizing.
2. Examine the charts below and calculate the diversity indices for the three samples.
3. Use the results from the previous question to describe the biodiversity of each sample.
Sample one is very diverse, sample two is somewhat diverse, and sample three is not as diverse.
Hypothesis:
The biodiversity at the edge of the forest will be moderately diverse due to its nearness to the woods and a water source. The independent variable is the location of the taken sample and the dependent variable is the biodiversity of the sample. The controlled variables include the general amount of leaf litter taken as a sample and the time spent under the lamp of each sample.
Problem:
What is the biodiversity of a sample taken from underbrush in the woods behind Heritage High School?
Materials:
-Compound microscope
-Leaf litter
-Alcohol
-Source of light
-Berlese Funnel
Procedure:
1. Collect a sample of leaf litter. Be sure to collect the entire layer down to the soil.
2. Examine the sample and classify what the layer is composed of.
3. Place the sample into the Berlese Funnel under the light source. Place a small beaker of alcohol under the funnel. The hope is that small invertebrates will travel away from the light and fall into the alcohol.
4. The next day, collect the beaker and examine the organisms collected under the microscopes. Calculate the number of each species you have, and identify them. Identify each species.
5. Use the information to calculate the diversity indices for your sample.
Observations and Data:
Location: Edge of forest in Wake Forest, NC with tree cover
Type of Community: Deciduous forest
Date: 9/21/12
Time: 2pm
Weather: clear skies
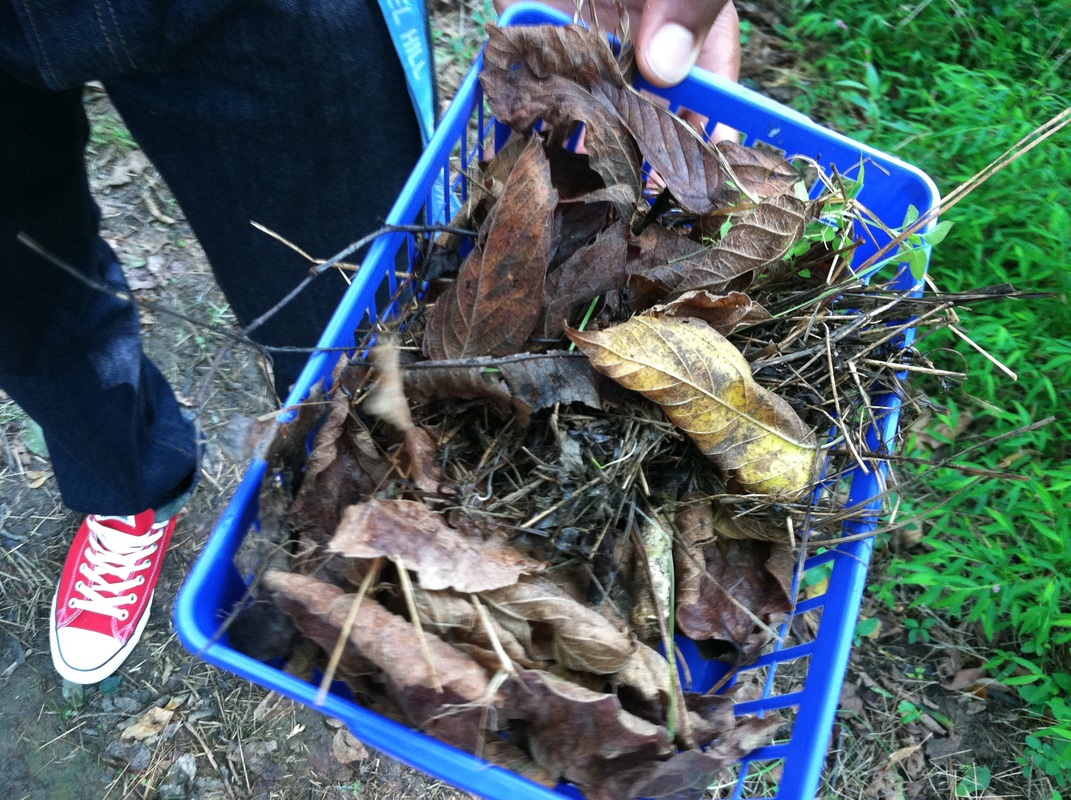
Photograph: Leaf litter sample found in the nearby underbrush.
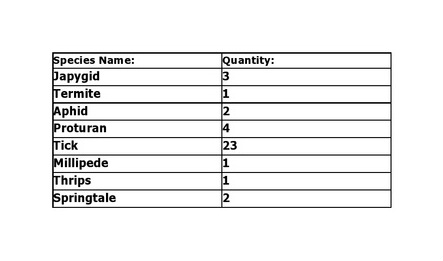
Calculations:
Simpson's Index: .47
Simpson's Index of Diversity: .53
Simpson's Reciprocal Index: 2.125
Analysis and Conclusions:
Lab Questions:
1. What are two reasons the organisms move away from the light down the funnel? What does this indicate about the organisms?
The organisms are trying to dig deeper into the soil and they are trying to avoid the light. This indicates that the organisms normally burrow through the soil, making it porous, and they may have sensitive vision (have emphasis on other senses such as smell).
2. Summarize whether you think the biodiversity of this litter is high or low density. If low, try to give some reasons why this might be.
The biodiversity of this sample was almost exactly between low and high. It had a .53 score on Simpson's Index of Diversity which means it was neither extremely high or low. The sample might have gotten a lower rating than expected because it was on the edge of the forest instead of deep in the woods. Also, the data could have been taken incorrectly (miscount number of organisms).
3. Why would an environmental scientist need to make more than one measurement if he was calculating the biodiversity? How would you take samples of a large forest?
Unless the scientist basically cleared the area to find the biodiversity for that specific point in time, he would need to take more than one sample at different times and weather conditions to account for the changes in the ecosystem. To take samples of a large forest, one could take the biodiversity of an area in the forest and then multiply it by the size of the forest.
General Conclusions/Analysis:
The results of the lab proved the hypothesis right: the biodiversity of the sample taken from the edge of the forest was found to be moderately diverse, probably because the sample was neither taken from within the forest or completely outside of it. It is possible that the data is inaccurate in that the species could have been counted or identified incorrectly. Also, the lab would produce more accurate results if it were repeated over a period of time under various weather conditions. This experiment applied Simpson's Biodiversity Index to demonstrate how to measure the biodiversity of an area. Also, it proved that there are thousands of organisms in some ecosystems that are not noticeable right away.
